Home › Benchmarks by Industry
Benchmark dataset
OEE benchmarks by industry (2026)
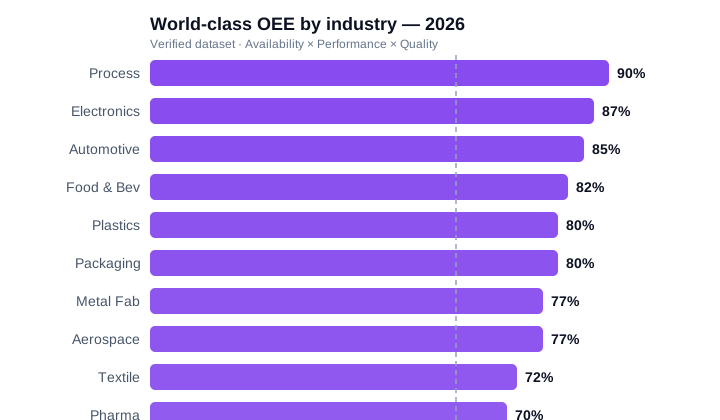
The short answer: most plants run near 60% OEE; the world-class benchmark is 85% (≈90% availability × 95% performance × 99.9% quality). Realistic targets vary by industry: the table below gives verified 2026 ranges, world-class targets and A×P×Q breakdowns for 18 industries.
What "world-class" actually means in your sector: the typical OEE range, the realistic sector target, and the Availability × Performance × Quality components behind it.
| Sector | Typical OEE | Sector world-class | A × P × Q target | Dominant loss |
|---|---|---|---|---|
| Automotive (Tier-1 assembly) | 70-85% | 85% | 92% × 95% × 99.5% | Changeover & minor stops |
| Electronics & semiconductors | 75-90% | 88% | 93% × 96% × 99% | Reduced speed & defects |
| Food & beverage | 60-80% | 82% | 90% × 93% × 98% | Changeover & startup losses |
| Pharmaceuticals | 35-45% | 70% | 80% × 90% × 97% | Validation & changeover |
| Continuous process (chemical, pulp) | 80-92% | 92% | 95% × 97% × 99.5% | Unplanned stops |
| Metal fabrication / machine shop | 45-65% | 78% | 85% × 88% × 96% | Setup & idling |
| Plastics injection moulding | 55-70% | 80% | 88% × 90% × 97% | Minor stops |
| Textile / apparel | 40-60% | 73% | 82% × 86% × 95% | Reduced speed & quality |
OEE = Availability × Performance × Quality. The single 85% target is a discrete-manufacturing legacy; process industries routinely exceed 90% while pharmaceuticals rarely pass 70%. Methodology: Editorial process.
2026 OEE Benchmark Report: free PDFWorld-class targets for 18 sectors, A×P×Q component breakdowns and the improvement sequence that recovers 5-15 OEE points: in one free PDF.
Download free →OEE benchmark by countryManufacturing data, sector OEE targets, downtime cost and incentives for 45 countries.
Open the country benchmarks →